XDEBUG enables you to walk through the execution of PHP source code and debug the code as it is executed in real-time. It is one of the most important tools that a PHP developer's toolbox and is well worth the time it takes to learn how to use it.
The following instructions will guide you to setting up Xdebug in the Backets editor. It is actually pretty straight forward once you know how.
It is assumed that you have already installed Brackets text editor and XAMPP (64-bit is faster) web server in C:\XAMPP. For this article, we will be doing this on Windows. If you have not already done so, set these up first. Initially, you will need to set-up your development environment :
- Install PHP Debugger in Brackets
- Enable XDEBUG in php.ini
- Install the XDEBUG Helper browser extension
Once you have your environment installed, you will be ready to start debugging PHP code anytime you need it.
Installing PHP Debugger in Brackets
The Brackets PHP Debugger extension is available for free and is easily installed from the Brackets extension library.
1. Install the PHP Debugger extension in Brackets.
2. Click DEBUG > Open Preference Files
3. In brackets.json, add the following highlighted lines (there may already be other lines):
{
     :    :    :
    "wordWrap": false,
    "php-debugger.idekey": "xdebug",
    "php": {
        "enablePhpTooling": true,
        "executablePath": "C:\\XAMPP\\php\\php.exe",
        "memoryLimit": "4095M",
        "validateOnType": "false"
    }
}
Don't forget the commas after the "false" on the wordWrap line.
4. Save.
5. Restart Brackets.
Enabling XDEBUG in php.ini
XDEBUG actually comes bundled with XAMPP. You need just activate it though the php.ini configuration file.
1. Start XAMPP
2. Click on the "Config" button for Apache and select php.ini.
3. Add the following lines at the bottom of the file. If you already had an [XDebug] section, update the values for each of the settings:
[XDebug]
zend_extension = "c:\xampp\php\ext\php_xdebug.dll"
xdebug.default_enable = 1
xdebug.idekey="xdebug" ; (note: use the same key in your web browser extension)
xdebug.remote_autostart = 0
xdebug.profiler_append = 0
xdebug.profiler_enable = 0
xdebug.profiler_enable_trigger = 1
xdebug.profiler_output_dir = "c:\xampp\tmp"
xdebug.profiler_output_name = "cachegrind.out.%t-%s"
xdebug.remote_connect_back = 0
xdebug.remote_enable = 0
xdebug.remote_handler = "dbgp"
xdebug.remote_mode=req
xdebug.remote_connect_back=0
xdebug.remote_host = "127.0.0.1"
xdebug.remote_log = "c:\xampp\tmp\xdebug.txt"
xdebug.remote_port = 9000
xdebug.trace_output_dir = "c:\xampp\tmp"
xdebug.remote_cookie_expire_time = -9999
xdebug.show_local_vars = 0
xdebug.max_nesting_level = 1000
4. Save.
5. Stop Apache in XAMPP.
6. Start Apache in XAMPP.
Installing the Xdebug Helper browser extension
Install the Xdebug Helper extension in Chrome or Firefox. Note that you should go into the extension's settings to ensure that the IDEKEY is set to Other and xdebug
Note: If you change editor, you may also need to change the IDE Key in Xdebug Helper.
Debugging PHP code in Brackets
Although not a requirement, two screens is highly recommended when debugging code, one for the editor and the other for the web browser.
1. In Brackets, open the PHP file that you want to start debugging.
2. Click on the PHP Debugger icon on the right side of the editor. This will open the debugger at the bottom of the screen.
3. Set a breakpoint in your code by clicking on the empty space to the left of the line number. Note that you can only set breakpoints for lines that actually contain executable code.
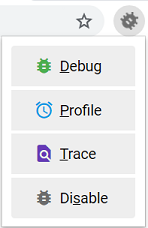
4. Back in your web browser, click the Xdebug Helper icon and select Debug.
5. (re)Load the page which makes use of the code you want to start debugging.
Note that your page may only appear partially or not at all in your browser. Do not panic. This is perfectly normal since the execution of PHP has been paused.
6. Now switch back to Brackets. You will find that it has interrupted your code at the breakpoint and is waiting for you to take action.
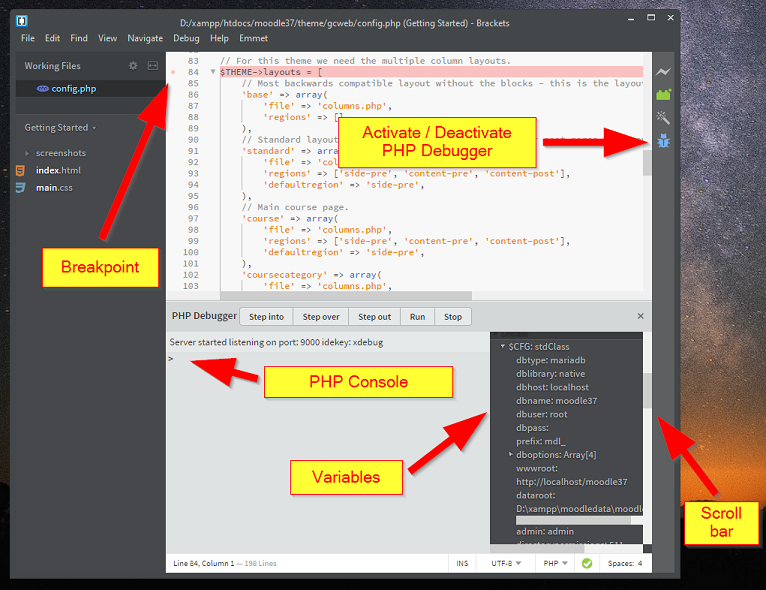
Here you can inspect the value of PHP variables in the right-hand column of PHP Debugger or click on Step Into, Step Over, Step Out, Run or Stop execution of your code. You can also type PHP commands at the command prompt or just type the name of a variable there to see its value.
If you don't see the variables, use the scroll bar on the right edge of the PHP Debugger window to scroll down.
March 27, 2023 at 4:50 AM
I prefer to use xDebug with Codelobster IDE.
July 26, 2023 at 5:33 AM
I prefer to use Codelobster IDE with xDebug.